iDigBio Specimen Portal Tutorial
(version 6.0, released June 2015)
Introduction
The iDigBio specimen portal (https://www.idigbio.org/portal) provides access to millions of records about neontological and paleontological specimens curated at museums and other institutions in the US. Records might include information about the specimen, when, where and by whom it was collected, the institution providing the data, images and other media related to the specimen. The main intent of this tutorial is to familiarize the user with the search capabilities of this portal.
Requirements
The iDigBio Portal requires the use of an HTML5 compliant browser with cookies enabled. The Portal has been tested successfully against, and is supported for, the following browsers:
Chrome
Firefox
Safari
Internet Explorer 10,11
Microsoft Edge
Portal Navigation
The main features of the portal can be accessed through the Green Menu Bar (Fig. 1) near the top of the page. The menu choices include links to the iDigBio Home, the Portal Home page, the Search Records page, Tutorial (this page), the Data page, the Research Tools page, and Feedback, which are detailed next.

The iDigBio Home link takes you away from the portal, and into the portion of iDigBio website containing information about the project, its workshops and working groups, research, education and outreach.
Use the Portal Home page to start searching Specimen Records quickly on a scientific name, and to view basic overall statistics about the existing data (i.e., distribution of data by collection type, and overall number of records). Search results are returned on a new page that allows a more comprehensive search.
Use the Search Records page for more comprehensive and specific searches. On this page, you can perform a Full Text Search and/or an Advanced Search and view the search results as detailed in the next section.
The Tutorial page is this page.
Use the Data menu to access the Publishers and Collections submenu pages. The Publishers page provides general count and usage statistics about the datasets and publishers provided to iDigBio. The Collections page provides a comprehensive list of collections and institutions that house data in the United States.
Use the Research Tools page to view research software that make use of services and data.
Use the Feedback page to provide input about what could be improved in the portal, technical problems you might be facing, questions on how to use the portal, or just to let us know that you are finding the portal useful!
About the iDigBio Portal Search
The iDigBio Search page is intended to be an example of what can be achieved with the iDigBio Search API by a software developer. The Portal Search runs entirely off of the public iDigBio search API. To learn more about the iDigBio Search API go here.
Searching iDigBio
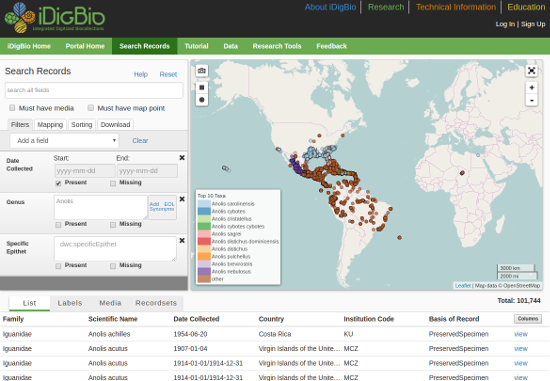
The iDigBio Search Records page is split into three main sections: the search form, the mapped search results and the record search results, as displayed in (Fig. 2).
Understanding and Performing Searches
The search form section of the Search Records page (Fig. 3) provides all fields necessary for doing full text and advanced exact match searching across iDigBio data. The search all field box allows you to search a term across all fields of the data simultaneously. If you search for ‘carex’, this term is searched in all fields, and the search returns records where ‘carex’ appears in a scientific name, genus, host, locality, or any other place where it appears, excluding substrings (parts of words). Searches are not case-sensitive, i.e., ‘carex’ and ‘Carex’ will return the same result. Checking the box Must have media restricts mapped and record results to those specimens that have related images and other media. Checking the Must have map point restricts the record results section to show only records that contain geopoint data (mapping results can contain only records with geopoint data).
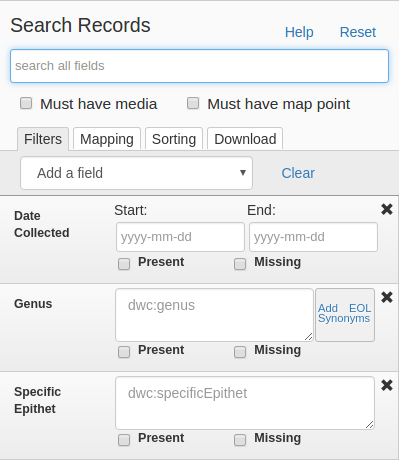
Filters tab
The Filters tab (Fig. 3) allows you provide exact text match and range searches for data fields. Multiple exact matches are possible with text matching filters by using a new line for each entry. In the case of date and range (elevation, depth, etc.) filters, only a single entry is possible per field box. Text filters also offer an autocomplete list (once you start typing) that filters based on already provided data in the system. The autocomplete feature for the Scientific Name and Specific Epithet filters also offer an "add all" feature next to each suggestion. This allows you to add all names that start with the suggested match as a whole word (i.e. add all californica would add calfifornica borealis not californicalis).
The Family, Genus and Scientific Name filters provide an "Add Synonyms" button which uses the Encyclopedia of Life API to find synonyms for names entered in the text box. Clicking the "Add Synonyms" button after entering one or more names will add any found synonyms to the text box.
Alternatively, each filter offers the possibility to match a record by the presence or absence of the data field in a record using the Present and Missing checkboxes respectively.
To reset the search form to its default state, use the Reset button or use the Clear button to simply clear the text boxes and check boxes on screen.
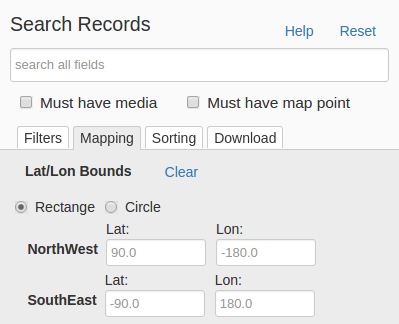
Mapping tab
The Mapping tab (Fig. 4) provides the ability to specify geographic boundaries for records through either a circular or rectangular boundaries. Using this feature limits all results to records with geopoint data. You can specify your bounding by either supplying the NorthWest and SouthEast lat/lon coordinates of a rectangle or provide a lat/lon point with a radius to create a circular boundary. Alternatively you can also draw the rectangle or circle boundary by using the draw feature provided on the map. This feature is covered in the map section of this tutorial.
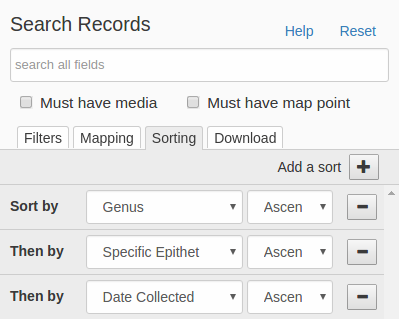
Sorting tab
The Sorting tab (Fig. 5) provides the ability on up to six data fields. The default settings for this tab sort results based Genus then Specific Epithet and then Date Collected. Sort rules can be added with the "Add a sort"  button and removed with the
  button.
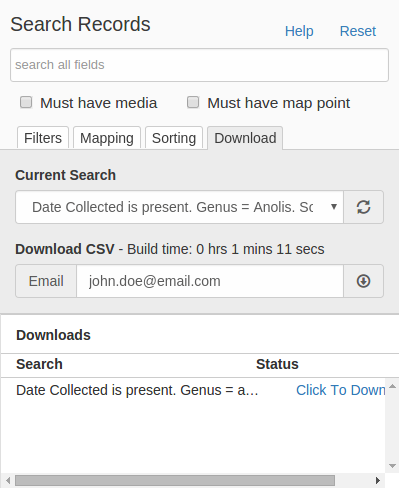
Download tab
The Download tab (Fig. 6) allows you to obtain all the record data in the current search result in Darwin Core Archive (DwC-A) format. You must provide a valid email address in the Email input box in order to run the download. Your email address is required so that a link to the DwC-A file can be sent to you in the event that you navigate away from the Search Records page. The approximate Build Time provides a rough calculation of the time it will take to generate the DwC-A. Once you click the download button, your download will appear in the Available Downloads box with a status of "pending". When your download is ready, a link to the download will replace the "pending" status.
A Darwin Core Archive is a zip file that includes one or more text CSV (comma separated value) files, each with a .txt extension and a descriptor (meta.xml) that contains metadata about the data set that you downloaded (e.g., who provided the data and the format). A data download that has images or other media associated with it will have two CSV files, one for specimen data and the other describing the media. The CSV file can be opened by any text editor or can be imported into a database or spreadsheet. A modestly sized download (100,000 records) can be readily opened in software like MS Excel. The easiest way to open a CSV file with Excel is to change the .txt extension to .csv before you open the file.
Viewing Results
Results data are displayed below the search form and mapped results sections. This section displays the total number of results matching your search criteria and gives you four options for displaying the results: List view, Label view, Media gallery and the Recordsets view. The List view allows you to display any number of columns of DwC data that are searchable in iDigBio. The right side of the List view headers provides a configuration button that allows you to select which columns are viewable in the list. The Label view displays a stylized specimen label, with a pre-determined set of information (taxonomy, geography, and collection data) and a thumbnail of a related image when available. The Media gallery displays all images and media associated with the specimen record search results. Each image contains a pre-determined set of information (taxonomy, collection data) displayed as a label over the image. Clicking on the image will open its associated media record. The Recordsets view provides a list of recordsets and record counts that are present in the search results.
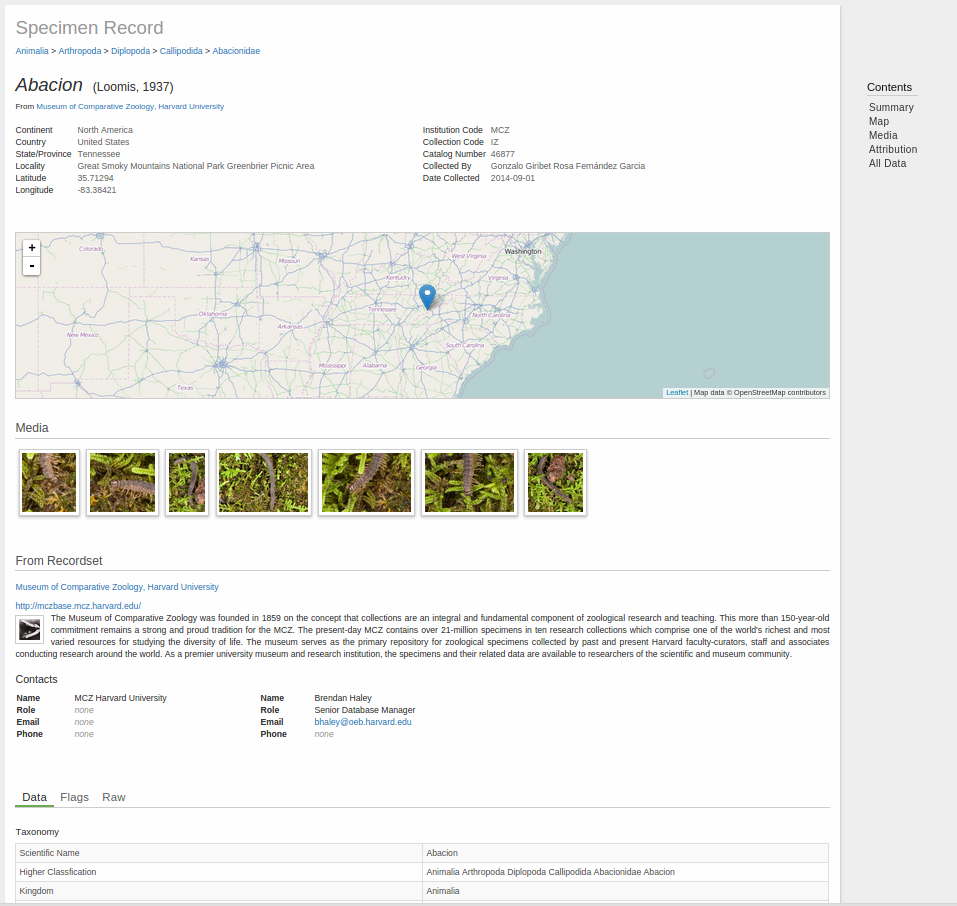
Clicking on a single row of the table or a single label displays a complete specimen record page (Fig. 7), including a summary section at the top, any associated media, a map with the location if applicable and the attribution information. The very bottom portion of the page includes all data available in the iDigBio API. It includes a complete list of the Darwin Core data, a list of data correction/issue flags and their descriptions and a complete view of the raw data as it exists in the API. With the raw data you can have a peek at the data that is available to you to add value to other portals. It can also be used to view additional information created by iDigBio, such as the internal GUID or when the record was ingested or updated in our system, and to detect whether iDigBio is not accurately displaying the data as it came from the provider.
Clicking on the image in the specimen page allows you to access the full-size image as well as metadata about the image. You can go back to the specimen information, using the view specimen record link next to the specimen name.
Mapped Results
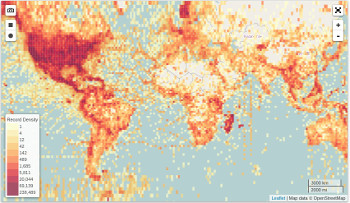
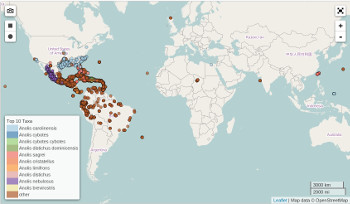
Any records that have been georeferenced (i.e., latitude and longitude coordinates are present) are included in the map view. The map displays results in two styles depending on the number of mapped results. When the results contain more than 100,000 points they will be displayed as a geohashed heat map (Fig. 8). When the results are a 100,000 or less, the results are displayed as individual points (Fig. 9), with each point assigned a unique color to distinguish between different taxa. The map legend in the lower left corner shows which colors correspond to which taxa for the top 10 taxa in the results (all other taxa use the same default color). Both the heat map and point displays allow you to select them to display the results in a pop-up box. In the case of the heat map, the results will be all records within the boundary of the geohash (heat) box where you select. In the case of selecting a point, the results displayed will be all those that fall within a radius of the point where you selected (the radius length varies depending on the zoom level of the map). The results pop-up box also provides a Set Map Bounds button. This feature allows you to set the Mapping tab parameters to the same parameters as the box or point that you selected.
The map provides several controls for further interaction. The top left corner provides two sets of controls. The camera button  allows you to create a PNG image of the map as displayed the moment you activate the button. This feature can take several seconds to generate the image. The buttons below the camera button provide boundary drawing capabilities. Use the rectangle button
  or circle button
  to draw a rectangular or circular boundary around a geographic area to further limit your results to records with geopoints inside the boundary. The button in the top right corner is a toggle between regular and a full screen mode. Below the full screen button are the zoom-in and zoom-out buttons. The map zoom can also be changed with a mouse scroll wheel when the mouse pointer is over the map. You can also draw a boundary to zoom in to by holding the shift button on your keyboard and using your mouse to draw the box boundary.
Linking to a Specific Search
The iDigBio Portal search page allows for predefining a specific search with a URI link using URL parameters that are similar to iDigBio API parameters. Below is a table of parameters and values accepted and an example URI.
| Parameter | Description | Values Accepted |
|---|---|---|
| rq | A JSON style object provided in the iDigBio Search API Query format. | See iDigBio Search API Query |
| sort | A JSON formatted object or array of objects using a key value pair to represent a value to sort on and a direction to sort either "asc" or "desc". | ex: {"genus":"asc"} ex: [{"genus":"asc"},{"species":"desc"}] |
| view | Which format to show the results in | value can be either "list", "labels", "media", "recordsets" |
The following URI example links to a search for specimens with Genus "Carex" that has images with the results sorting on Specific Epithet and results view set to the Labels view. https://www.idigbio.org/portal/search?rq={"genus":"carex"}&sort=specificepithet&view=labels